Live Market Intelligence
A real-time tick data pipeline for algorithmic trading, built on Microsoft Fabric Real-Time Intelligence.
Project description
Built a real-time market data pipeline in Microsoft Fabric Real-Time Intelligence to replace a batch-refreshed price feed that was introducing 15–45 minute data latency into an algorithmic trading firm’s signal generation. The project ingested live OHLCV tick events for 240 monitored equity symbols, routed them through a governed Eventstream into a KQL Database, and surfaced sub-second signals through a live dashboard backed by automated drawdown alerting, giving trading strategies a price reference that reflects market reality instead of a stale snapshot.
Technology used
Microsoft Fabric, Real-Time Intelligence, Eventstream, Eventhouse, KQL Database, KQL (Kusto Query Language), RTI Dashboard, Activator, Fabric Workspace (F2 capacity).
Project scope
- Provision an isolated Fabric workspace and Eventhouse to host the real-time pipeline
- Define the
StockTicksschema (Ticker, Date, Open, High, Low, Close, AdjClose, Volume) and aPipelineAuditLogschema before any data ingestion begins - Connect a live tick data source to the KQL Database exclusively through a governed Eventstream, with no direct table writes permitted from notebooks or external tools
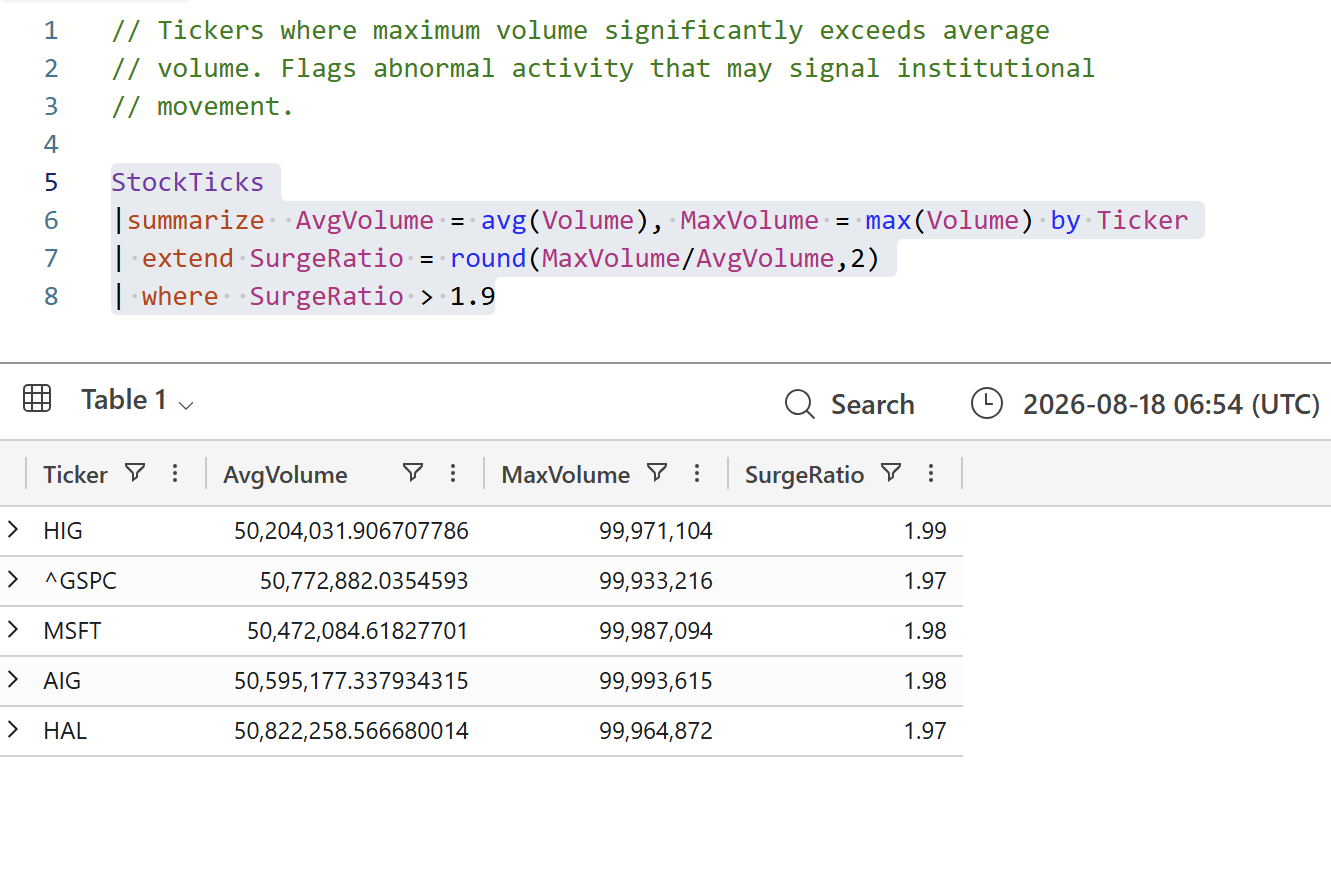
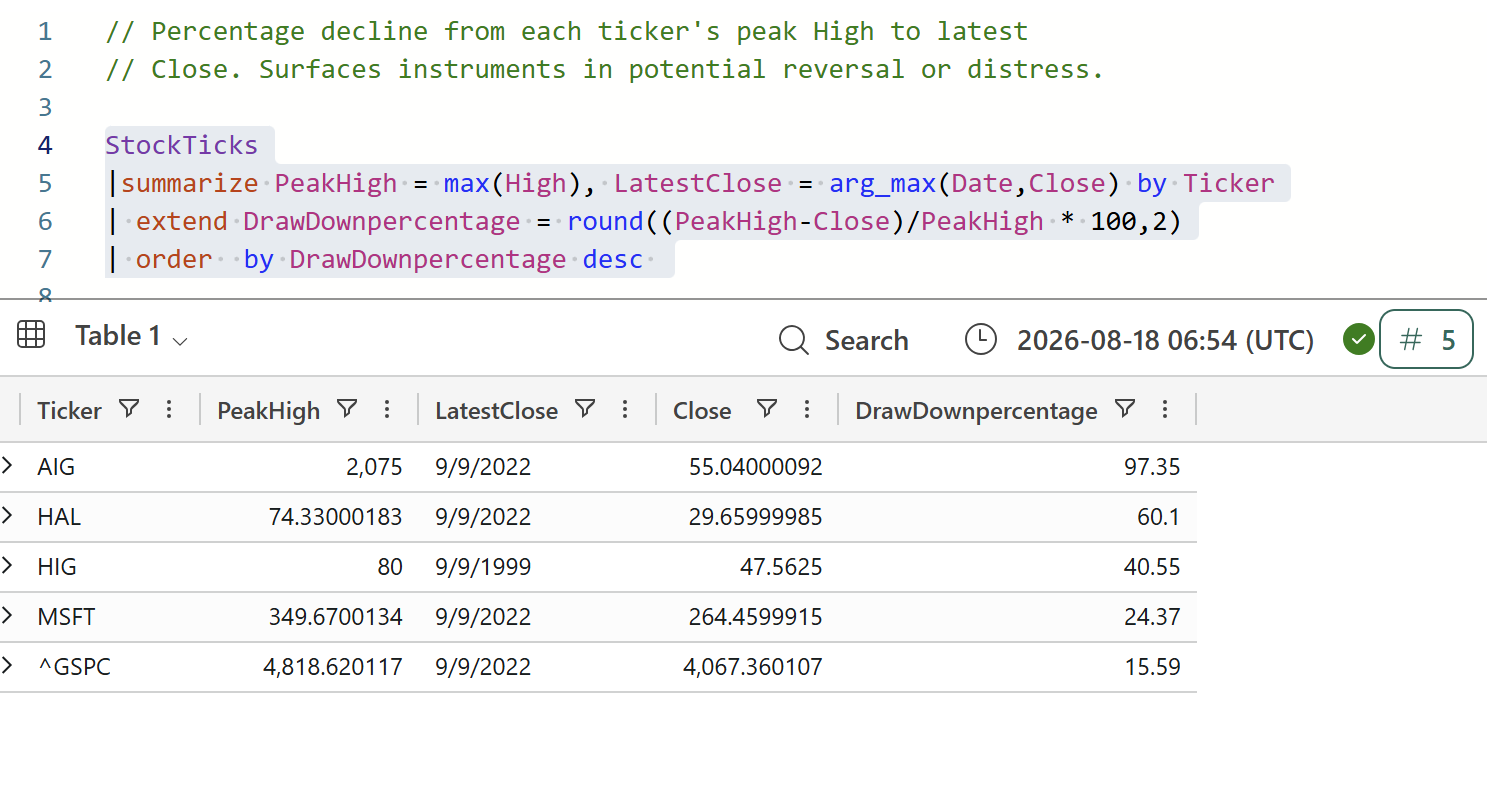
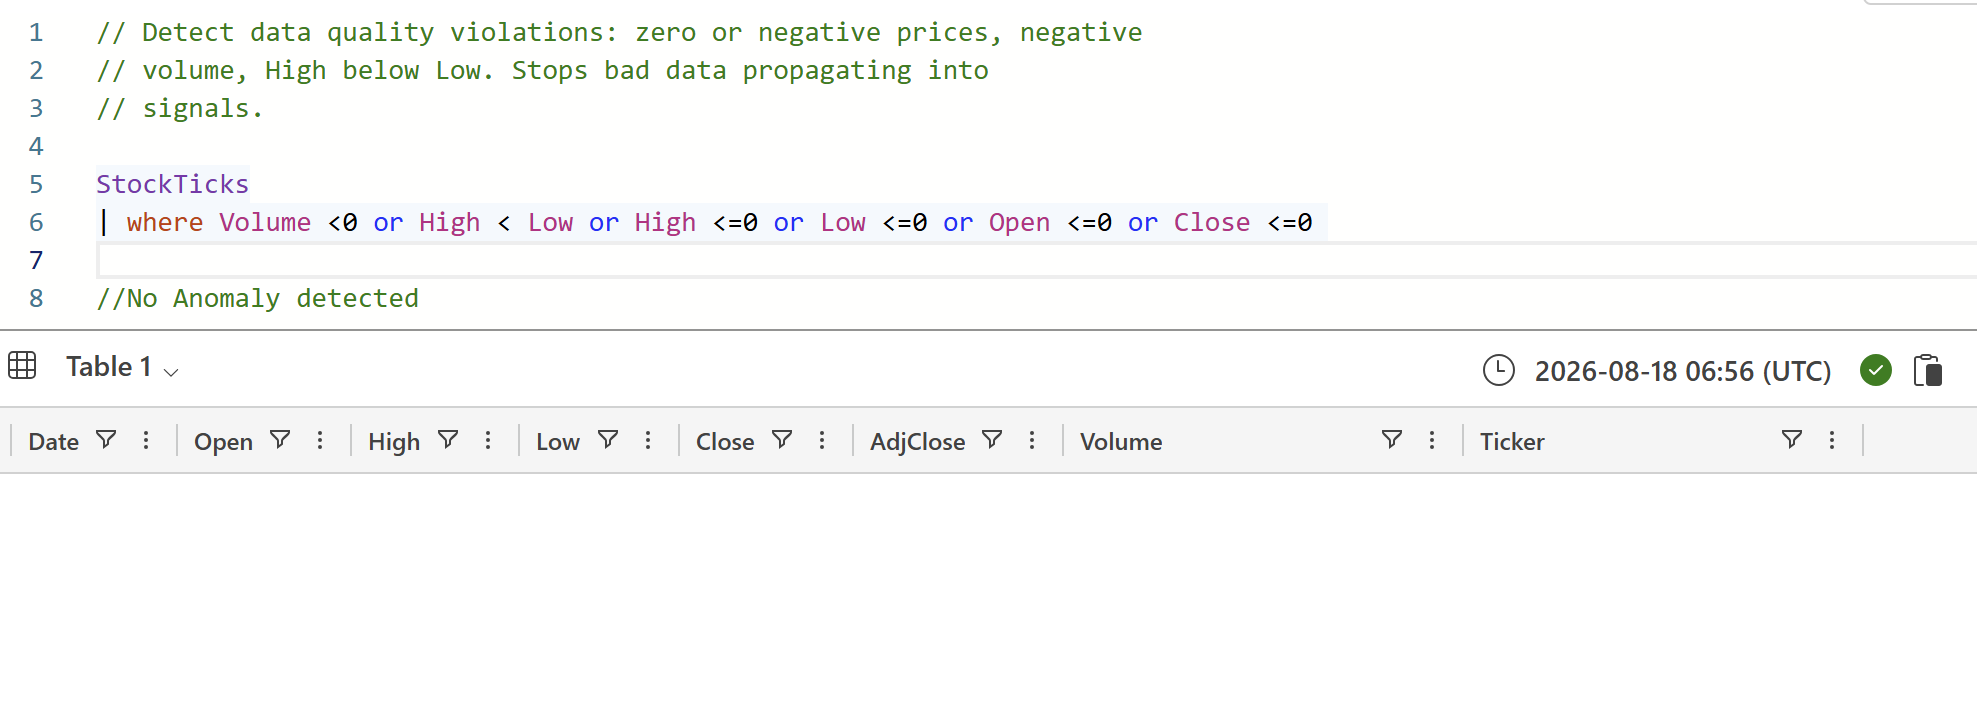
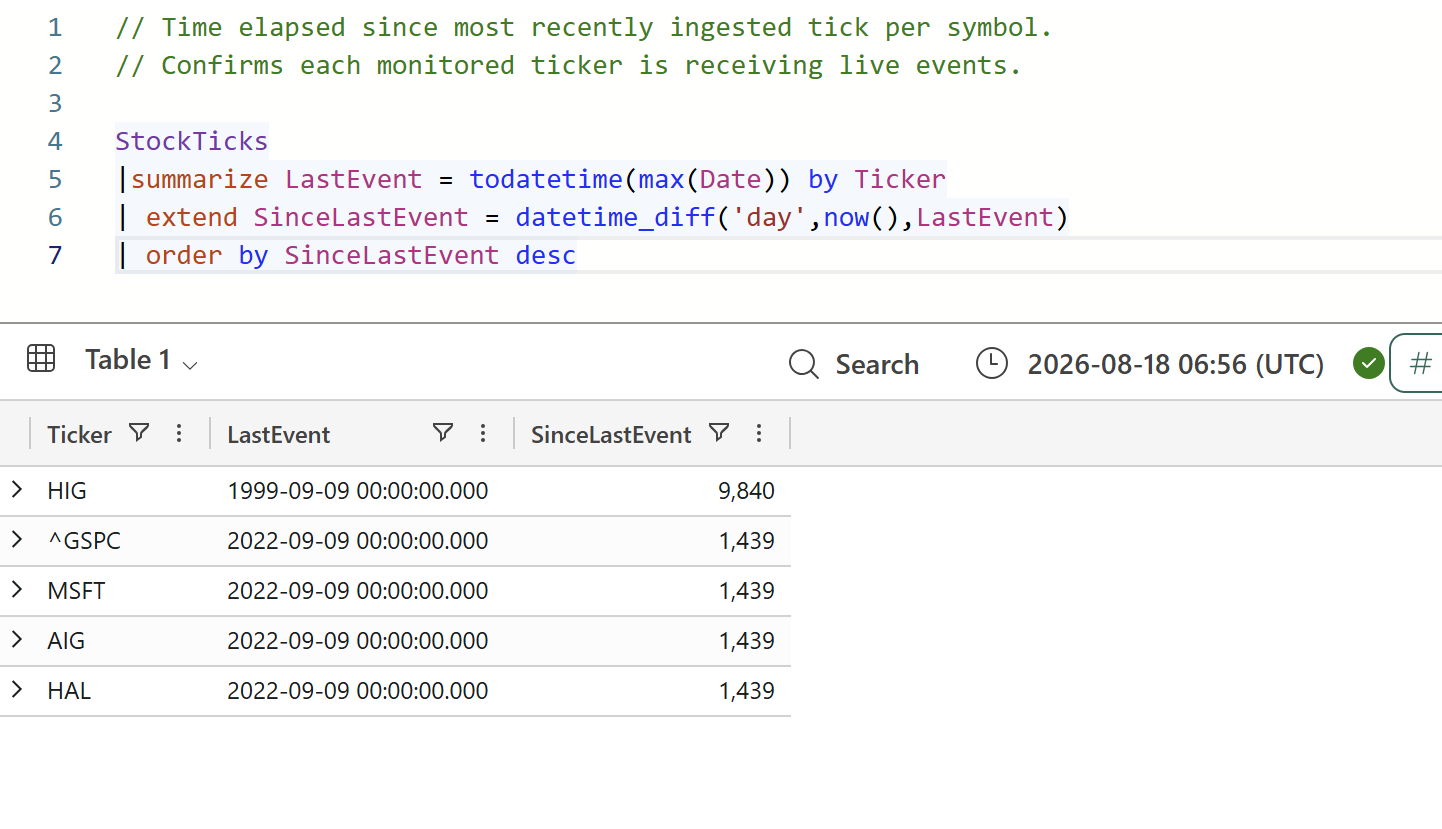
- Build and register an eight-query KQL library covering latest close, intra-day range, daily return, volume surge detection, price drawdown, anomaly detection, pipeline freshness, and derived field integrity
- Deploy a three-tile Real-Time Intelligence dashboard (latest close, intra-day range, volume surge) with 30-second auto-refresh
- Configure an Activator alert that fires when Close falls below Low per ticker, with deduplication within the evaluation window
- Maintain a complete audit log of every pipeline configuration change, and produce a documented end-to-end trace from source event to alert
Challenges
Latency-driven return leakage. Batch refresh cycles of 15–45 minutes caused signal timing errors estimated at 12–18 basis points per trade, translating into $2.1M–$3.4M in quarterly return leakage that had to be closed at the infrastructure level, not the strategy level.
No event-level audit trail. The batch model overwrote each price snapshot, leaving no way to reconstruct the exact market data state at a given decision timestamp: a direct compliance gap under MiFID II-style reconstruction requirements.
Governance under a strict no-direct-write mandate. All tick data had to flow through a single governed Eventstream identity, meaning schema design, table creation, and access restrictions all had to be finalised before a single event was allowed to land.
Data type risk at scale. NYSE and NASDAQ per-tick volumes could exceed the standard integer range, requiring the Volume field to be typed correctly from the outset to avoid silent data corruption downstream.
Distinguishing real alerts from noise. The drawdown alert had to fire reliably on genuine Close-below-Low breaches per ticker while suppressing duplicate notifications for repeated breaches within the same window.
Solution
Step 1: Provision the workspace and Eventhouse
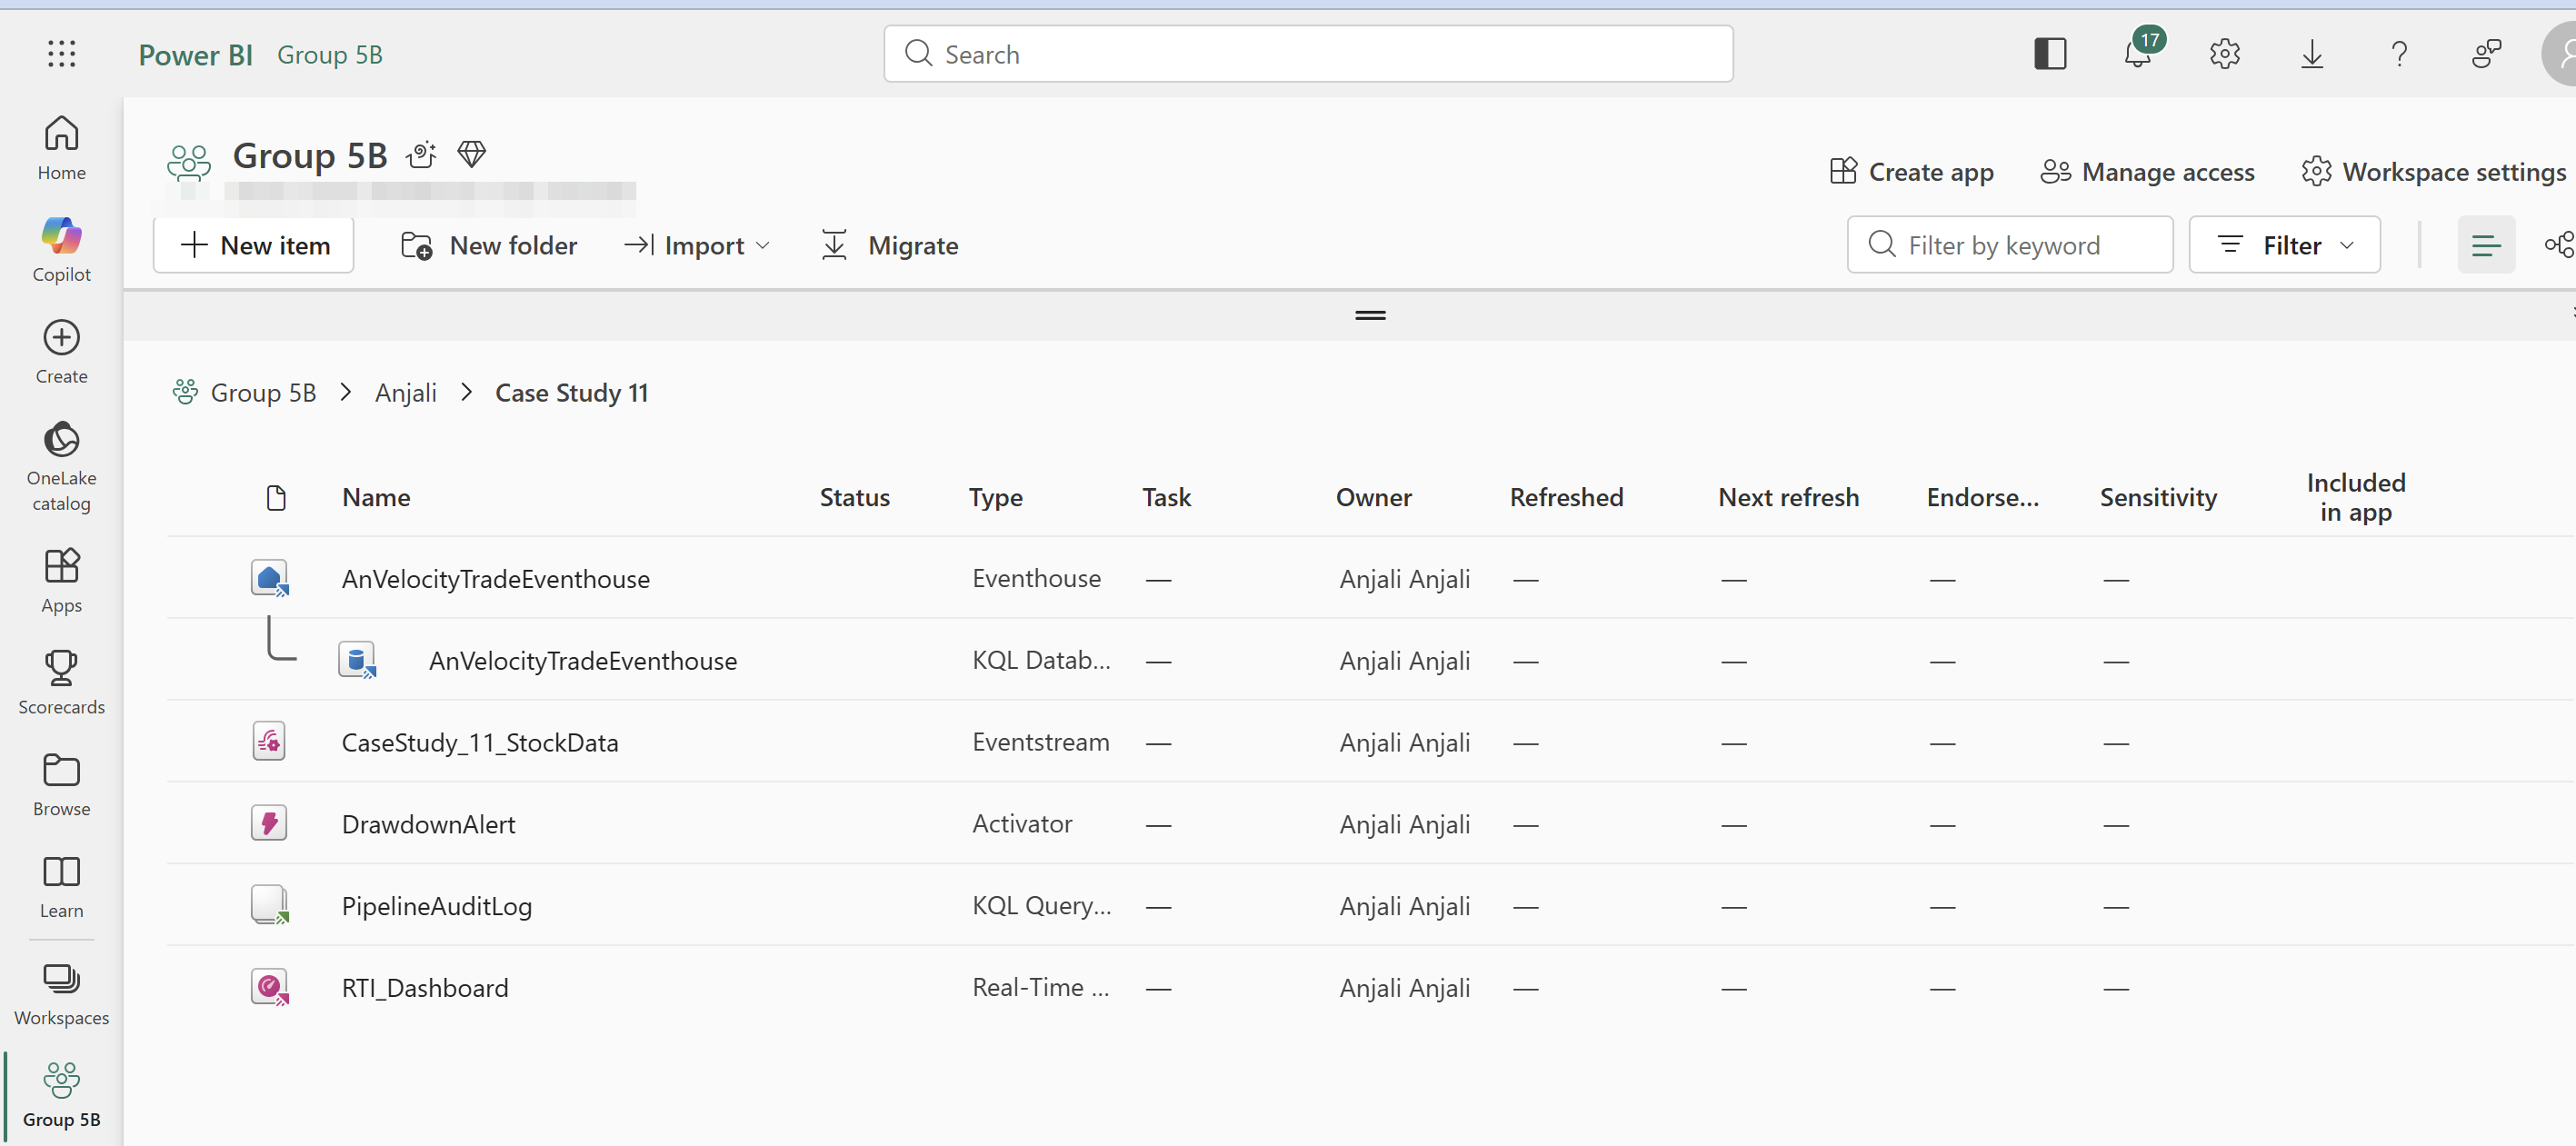
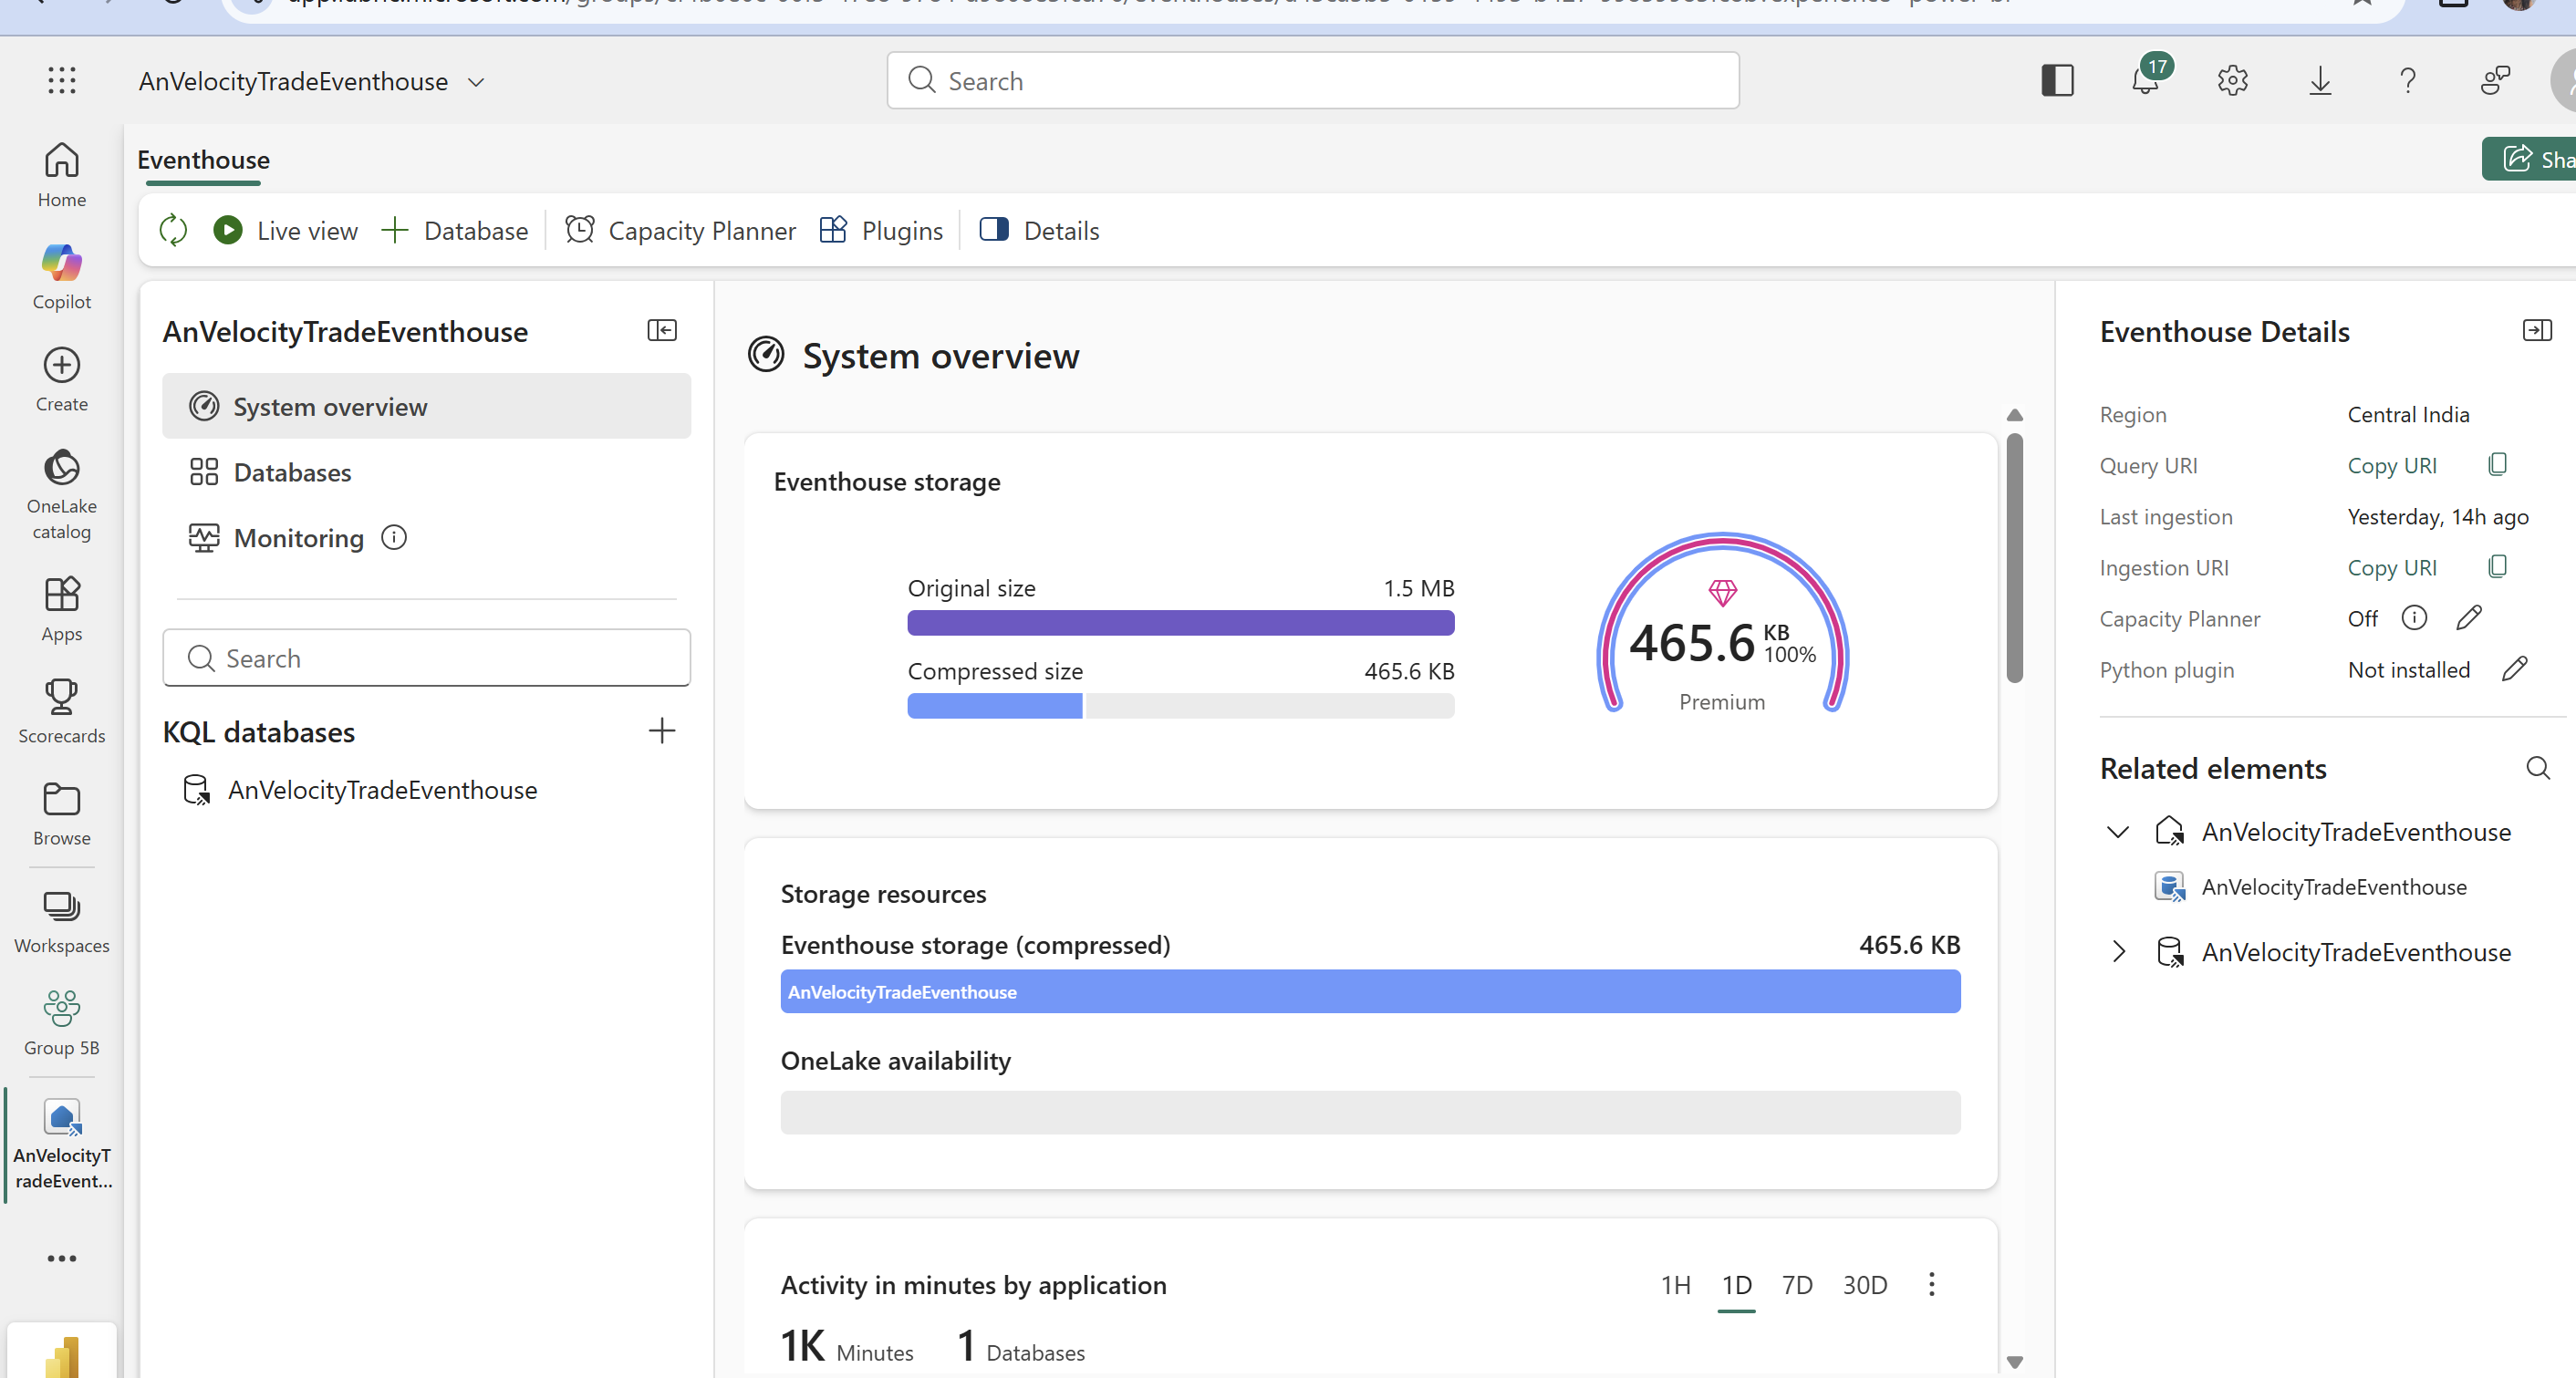
Created an isolated Fabric workspace (F2 capacity) to host the pipeline, then provisioned an Eventhouse to serve as the real-time data store for the trading desk.
 View full size (opens in a new tab)
 View full size (opens in a new tab)
Step 2: Define the KQL Database schemas before any data lands
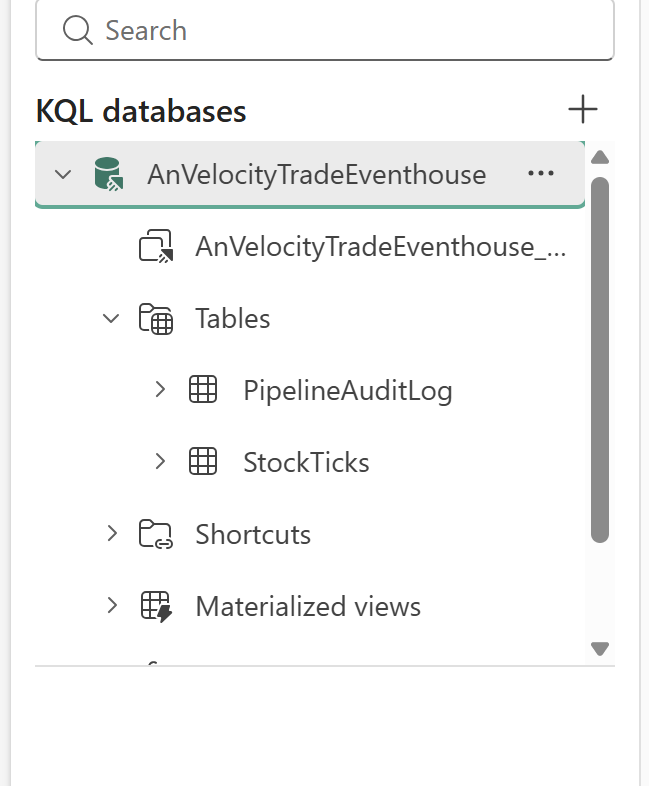
Created two tables inside the Eventhouse’s KQL Database: StockTicks (Ticker, Date, Open,
High, Low, Close, AdjClose, Volume, with Volume typed as long to safely handle high-volume
NYSE/NASDAQ symbols) and PipelineAuditLog (ChangeTimestamp, Author, ComponentChanged,
ChangeDescription). Both schemas were finalised before the Eventstream connection.
 View full size (opens in a new tab)
Step 3: Connect the governed Eventstream
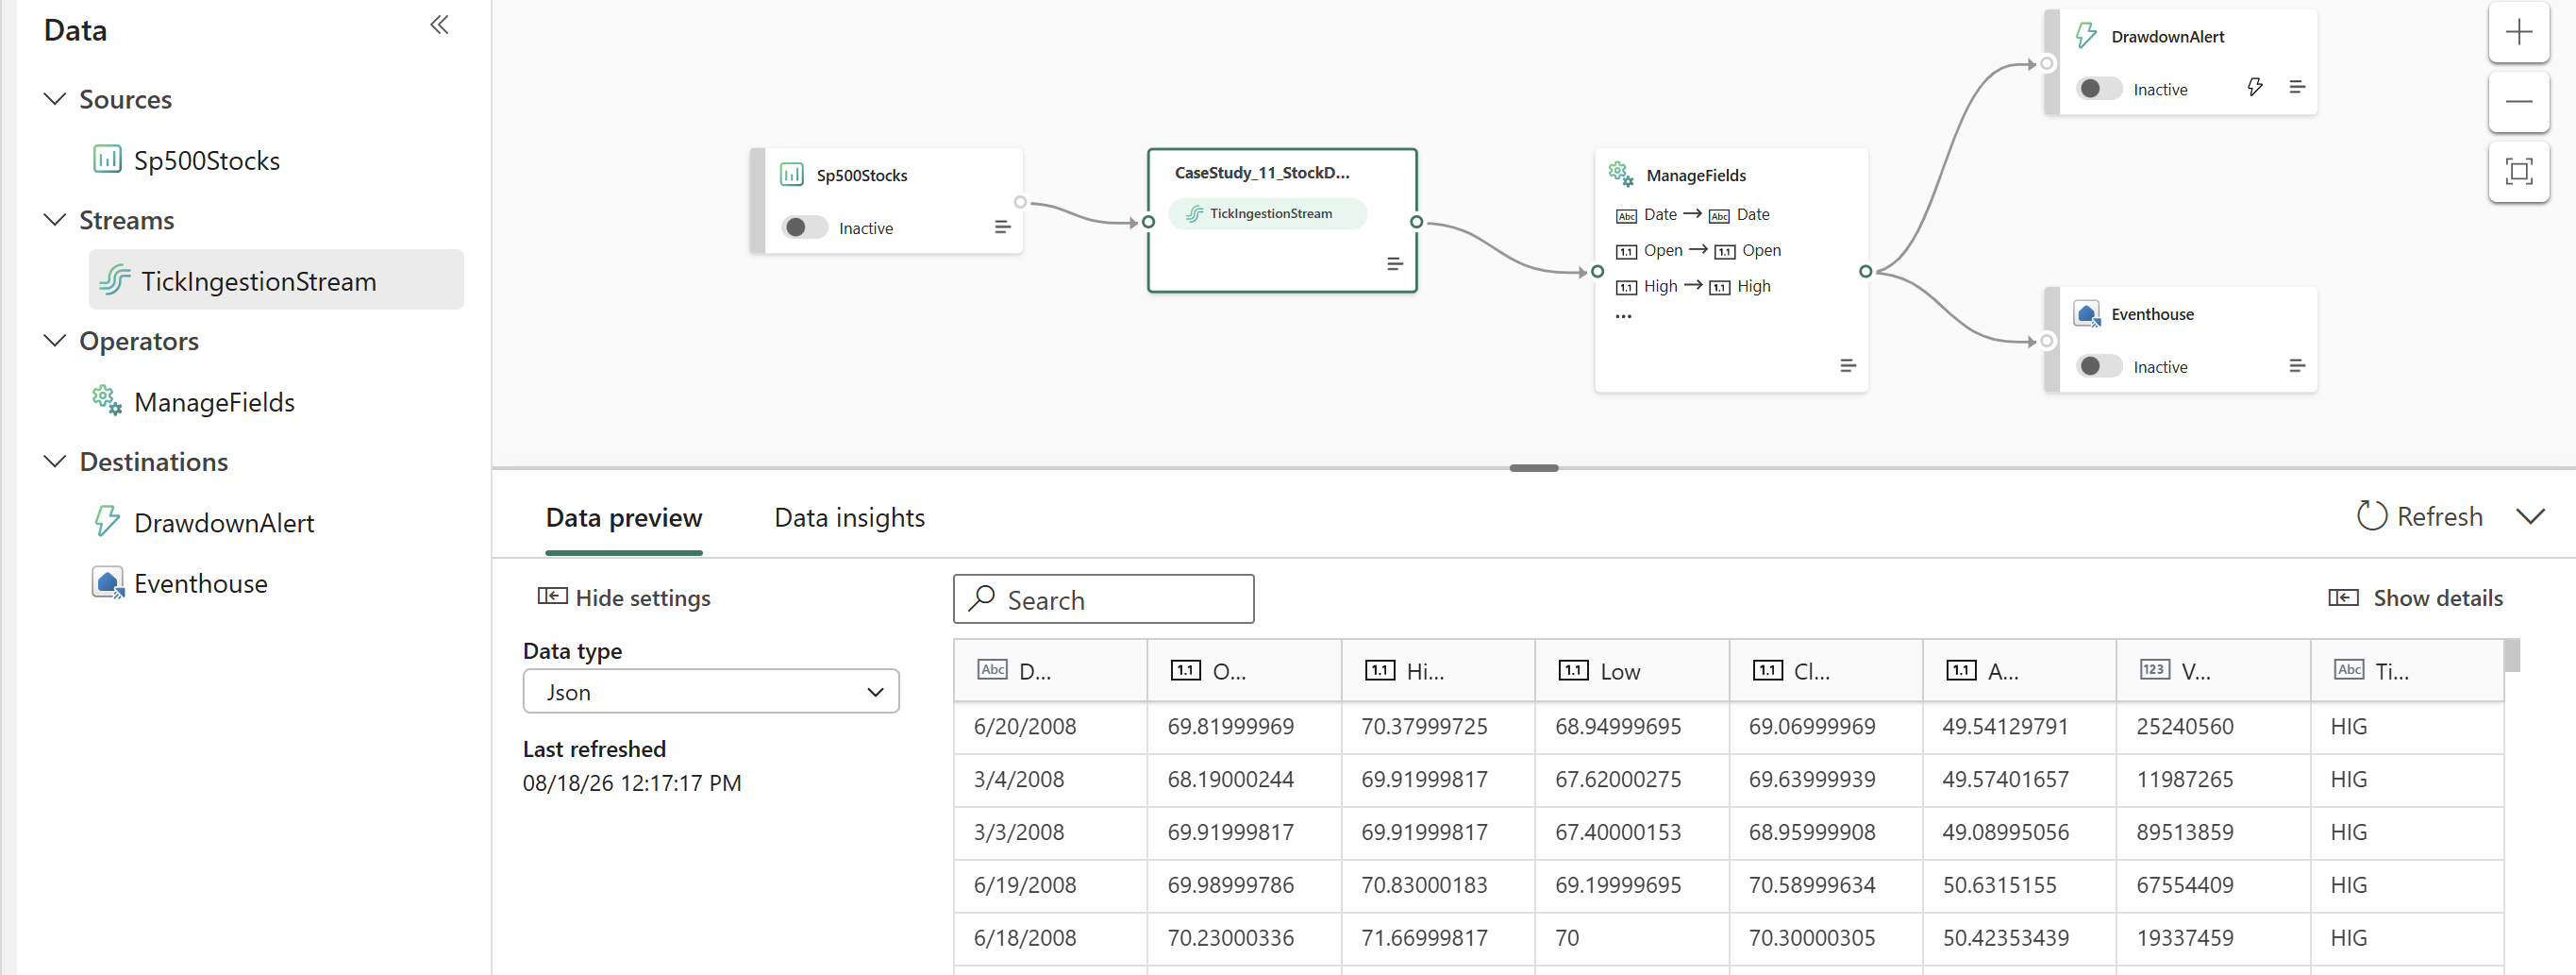
Configured TickIngestionStream as the sole ingestion path from the live tick source,
routing events into StockTicks. Write access was restricted to the pipeline identity: no
direct writes from notebooks or external tools.
 View full size (opens in a new tab)
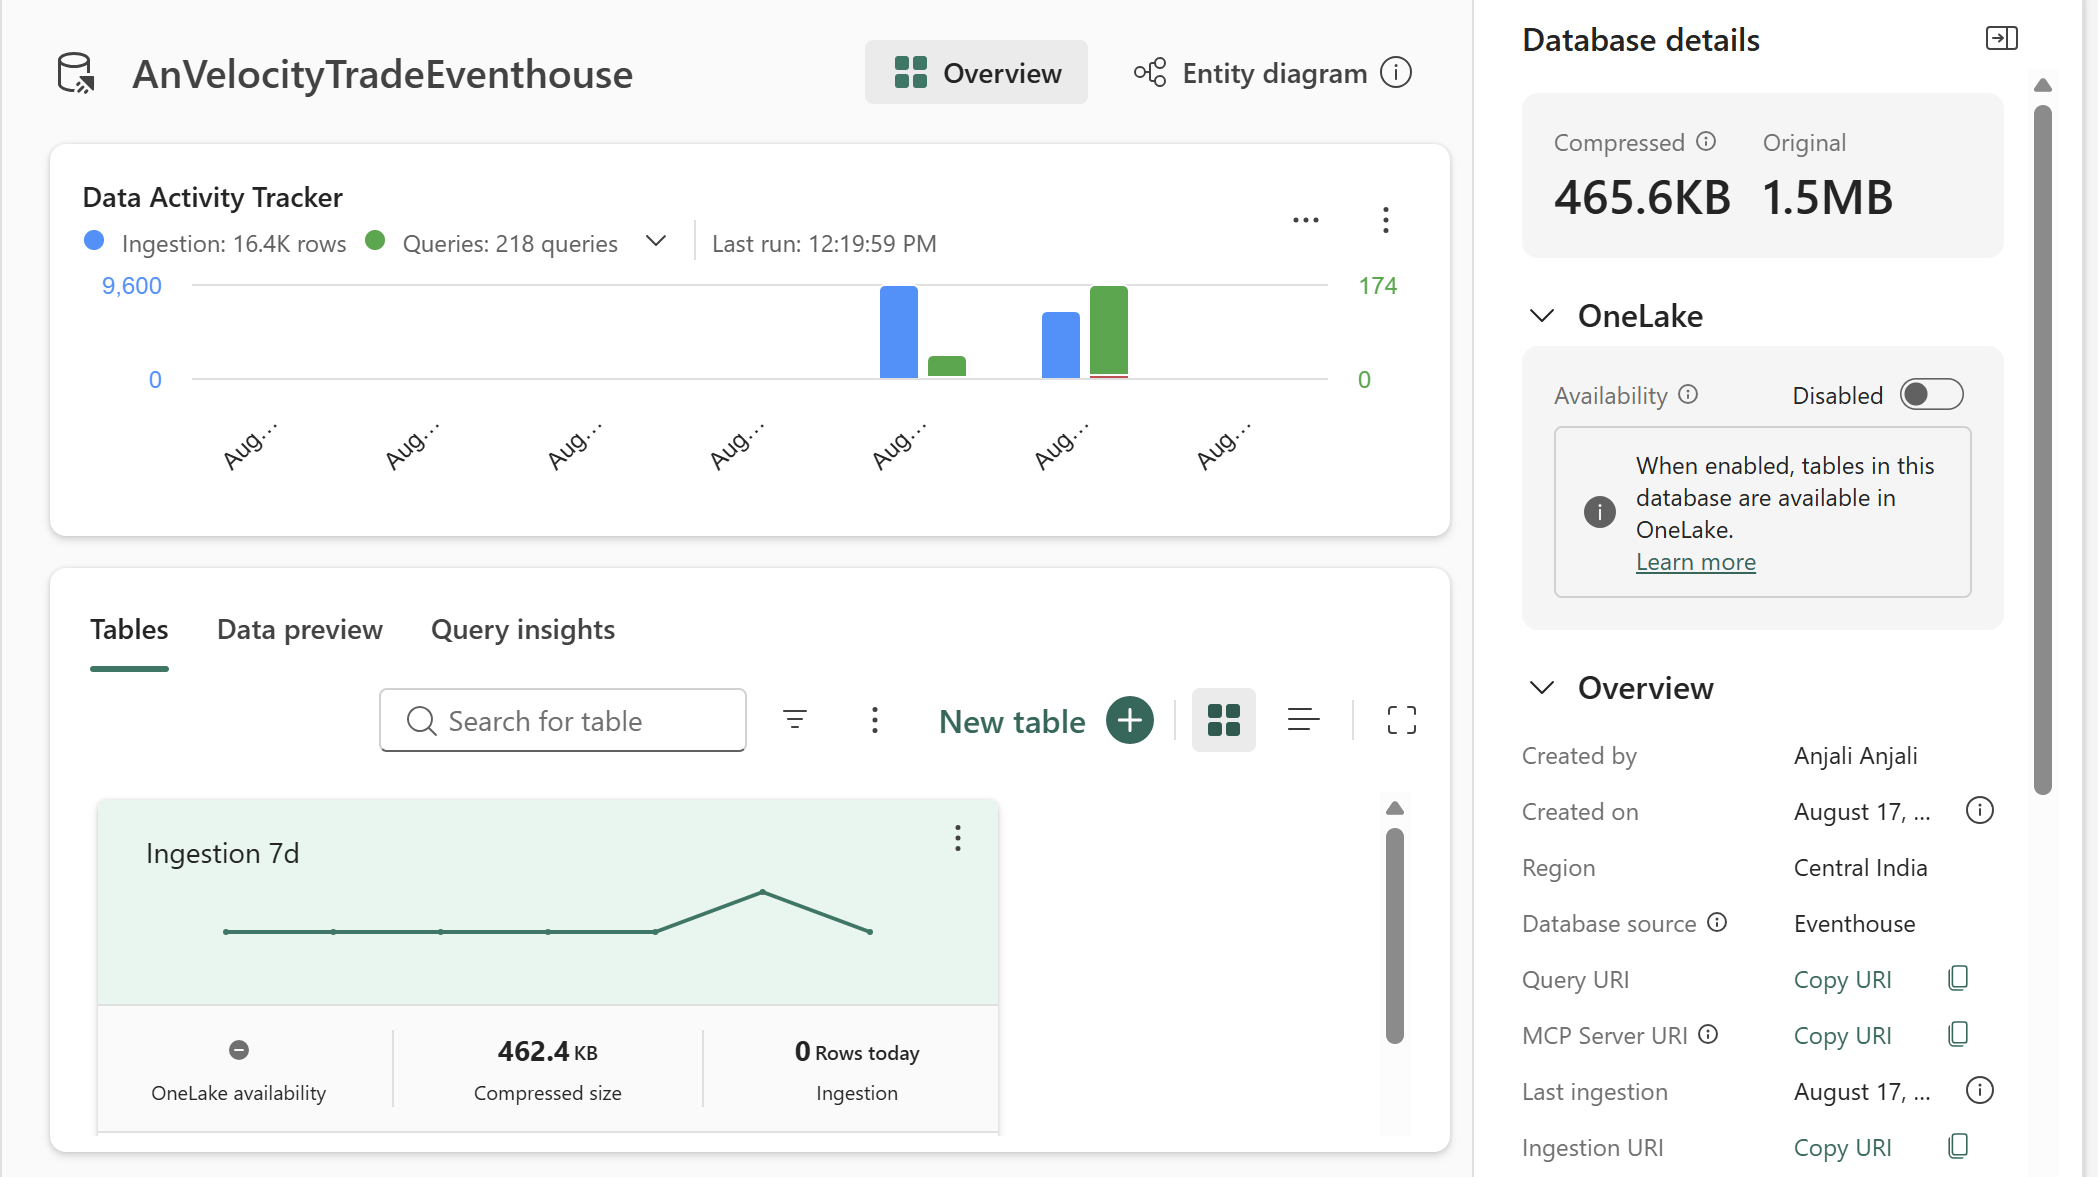
Step 4: Validate live ingestion
Confirmed a non-zero, increasing row count in StockTicks, verifying tick events were
flowing continuously from the source.
 View full size (opens in a new tab)
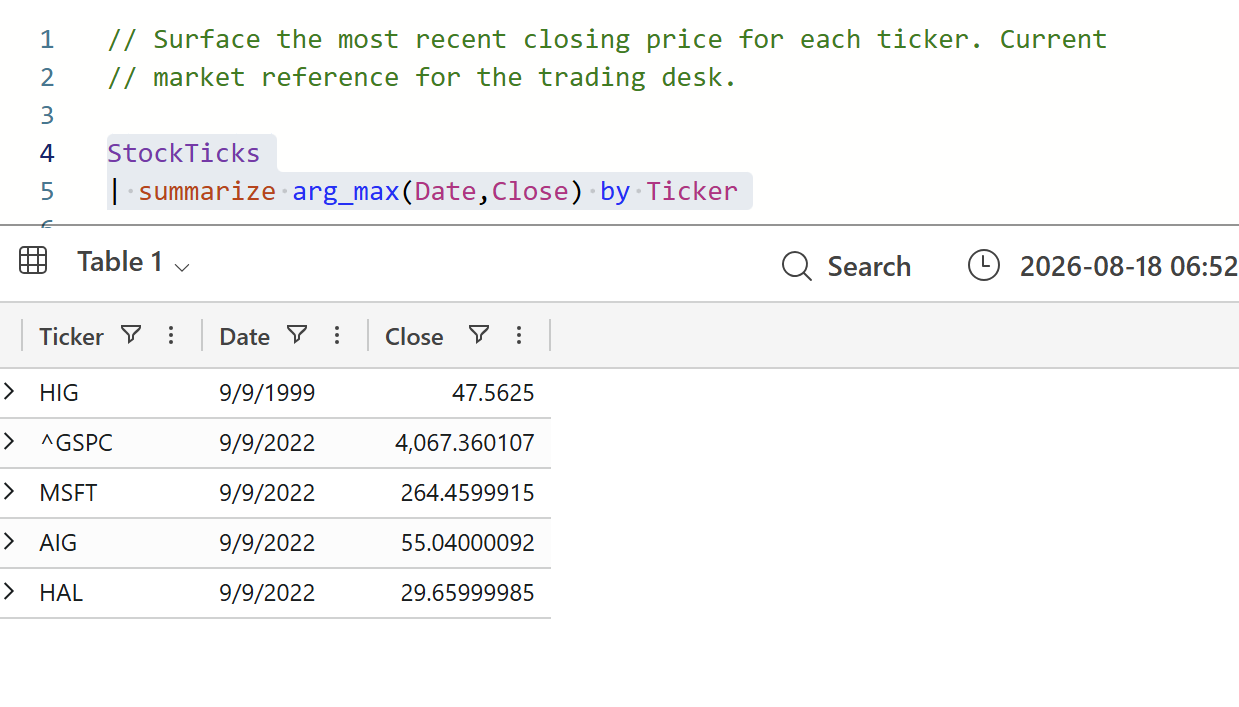
Step 5: Build and register the KQL query library
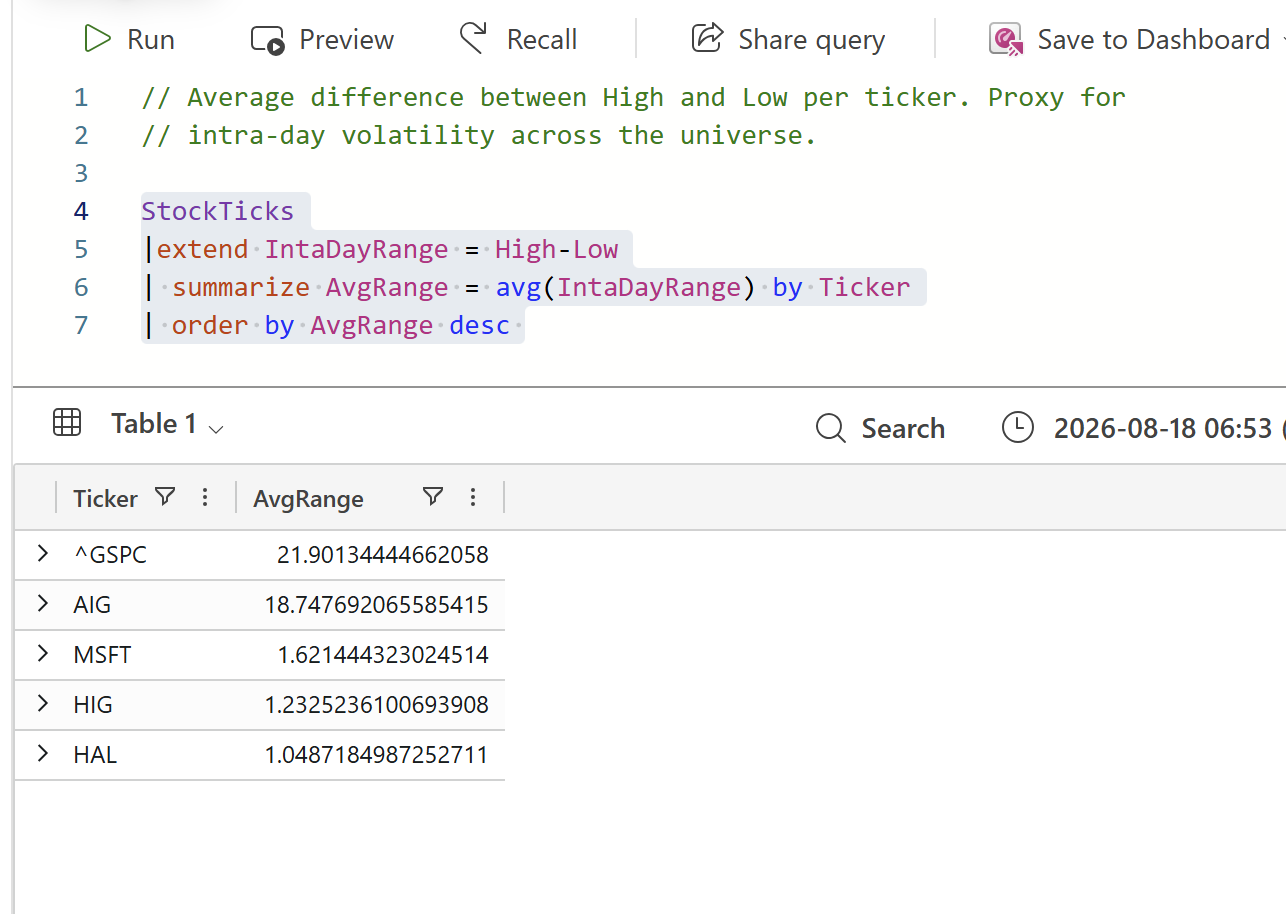
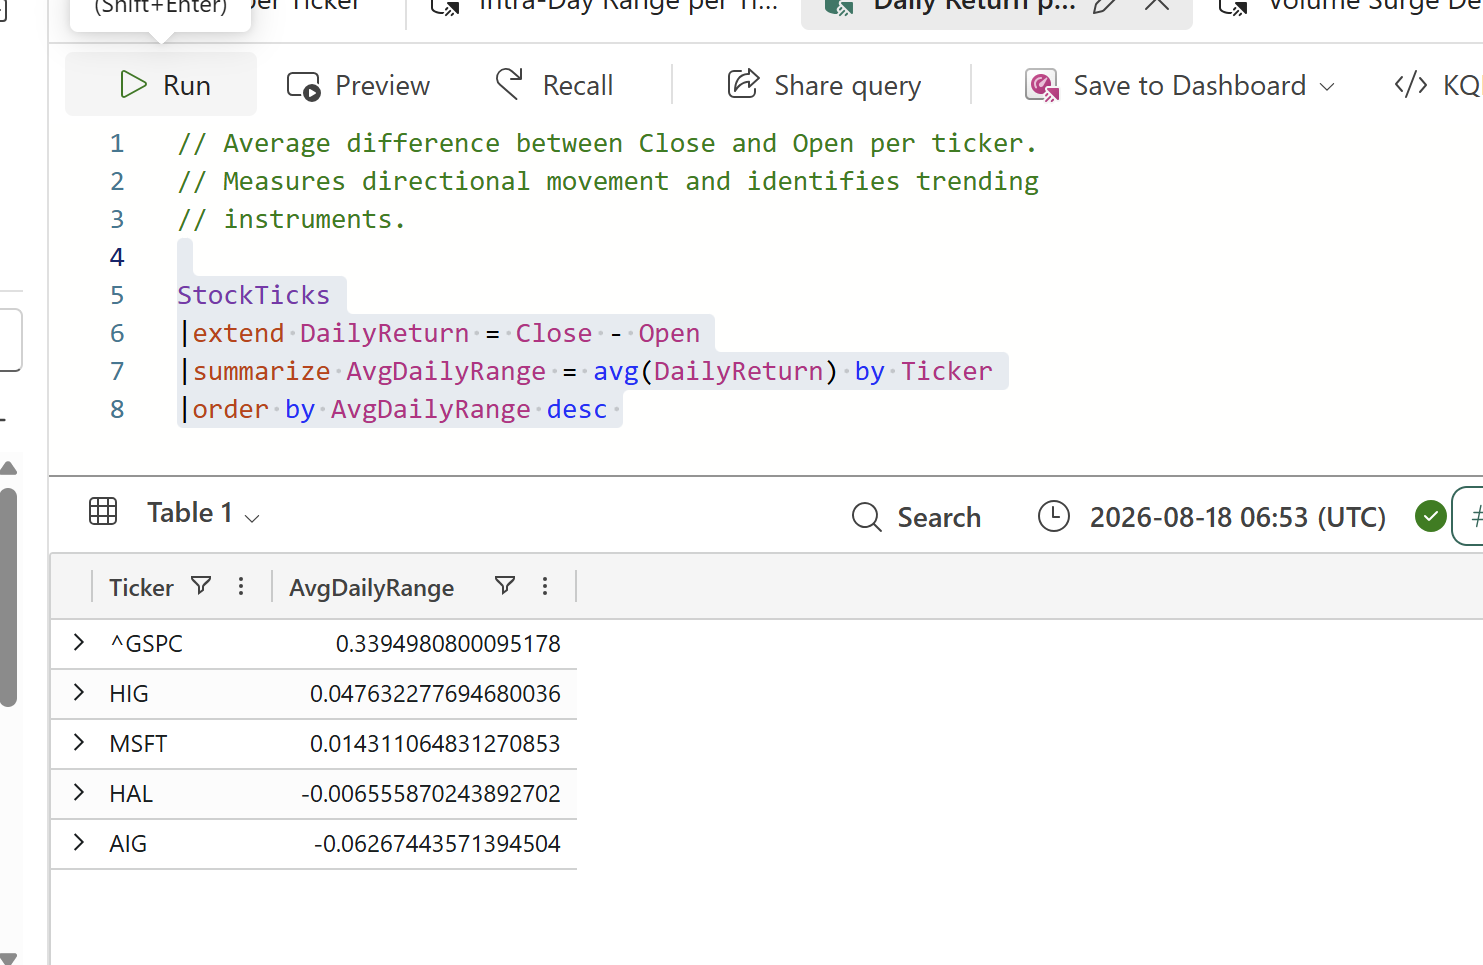
Wrote and validated eight KQL queries against live streaming data, then registered them in
MarketDataQueries with a documented business purpose for each, covering latest close,
intra-day range, daily return, volume surge detection, price drawdown, anomaly detection,
pipeline freshness, and derived field integrity.
 View full size (opens in a new tab)
Query 2:
 View full size (opens in a new tab)
Query 3:
 View full size (opens in a new tab)
Query 4:
 View full size (opens in a new tab)
Query 5:
 View full size (opens in a new tab)
Query 6:
 View full size (opens in a new tab)
Query 7:
 View full size (opens in a new tab)
Step 6: Deploy the live dashboard
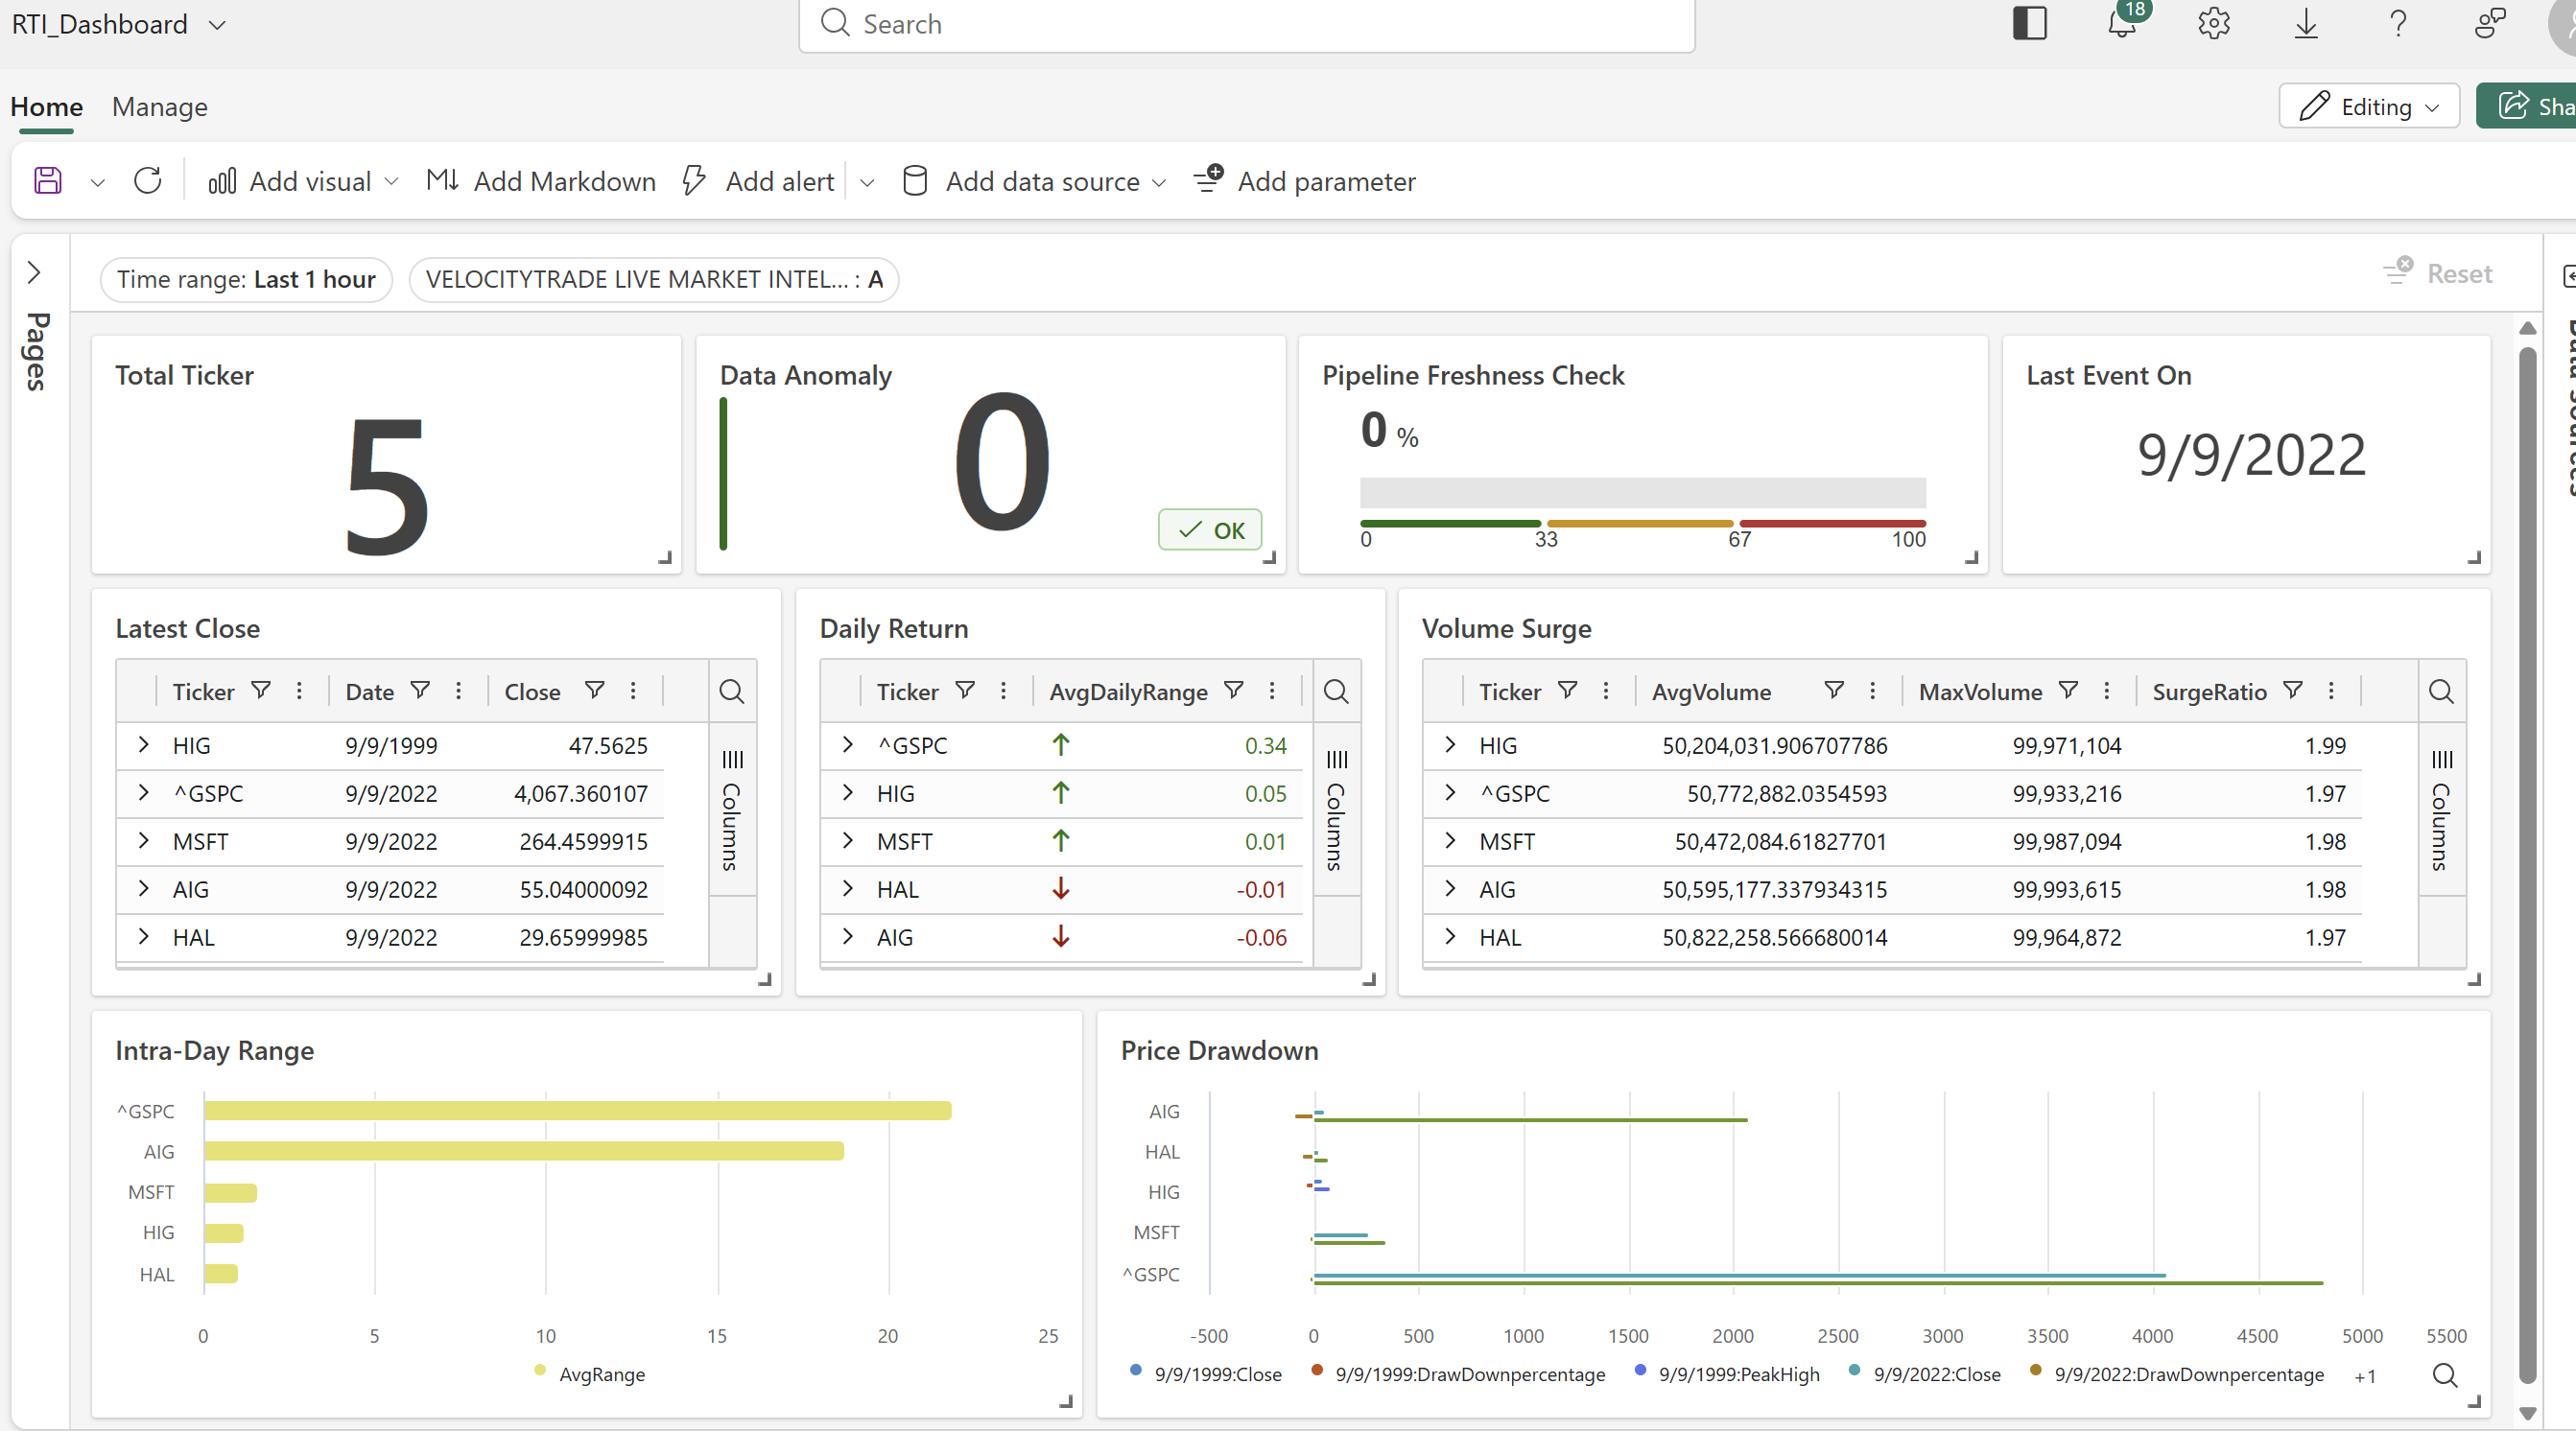
Built a three-tile Real-Time Intelligence dashboard, latest close, intra-day range, and volume surge, each powered by a query from the library, with auto-refresh set to 30 seconds.
 View full size (opens in a new tab)
Step 7: Configure the drawdown alert
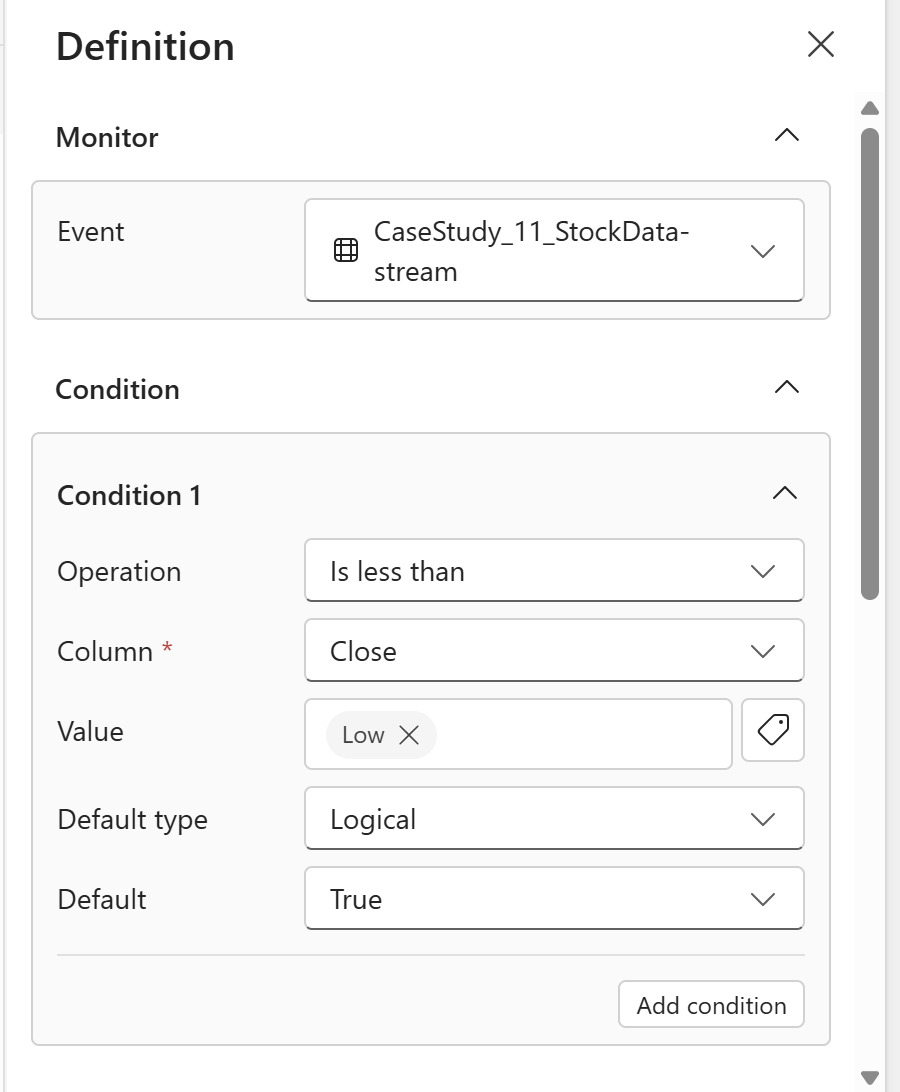
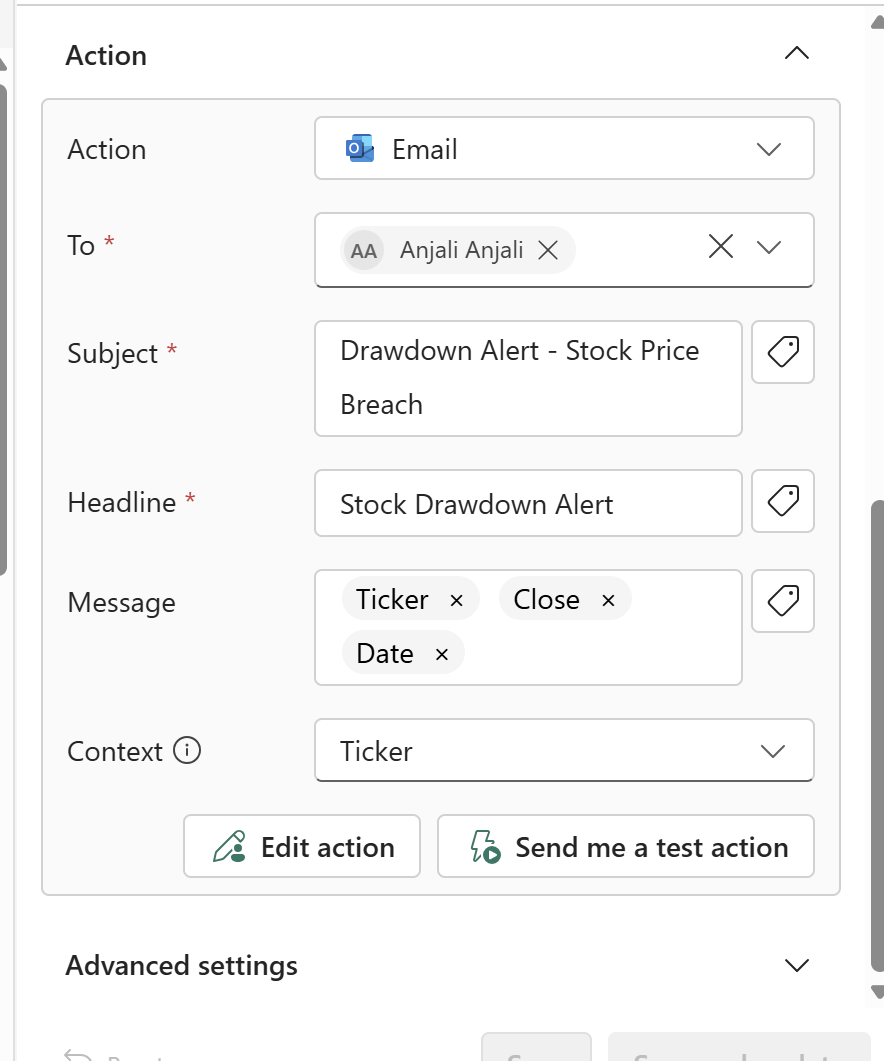
Set up an Activator alert that triggers when Close falls below Low, grouped independently by ticker, with deduplication so repeated breaches within the same window don’t produce duplicate notifications.
 View full size (opens in a new tab)
 View full size (opens in a new tab)
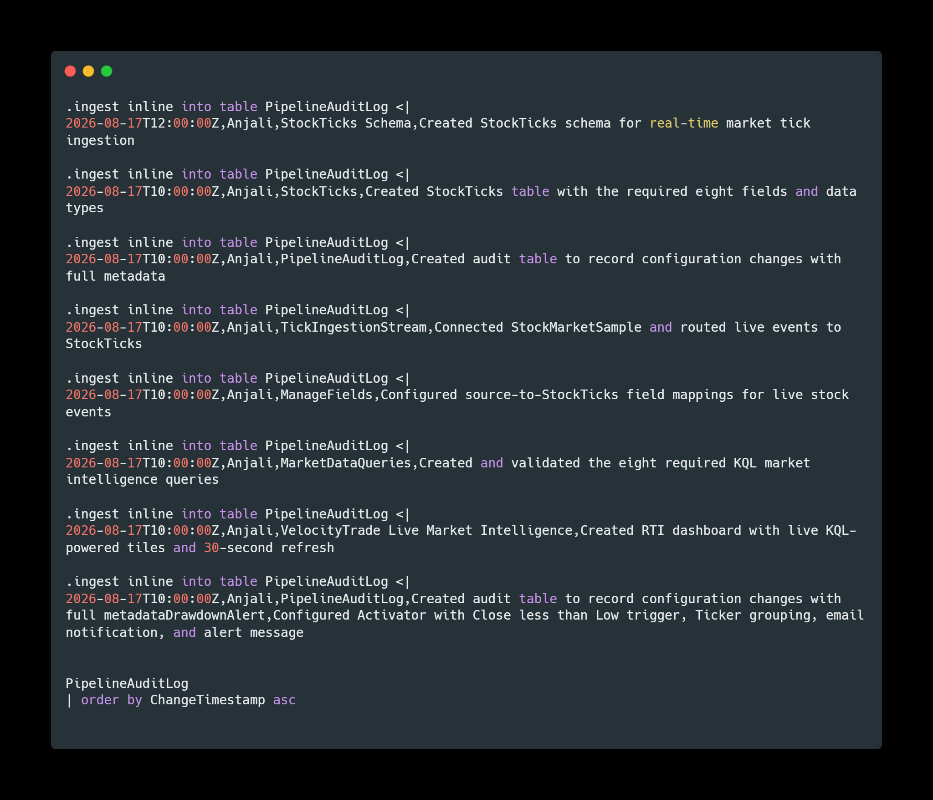
Step 8: Confirm audit completeness and trace end-to-end
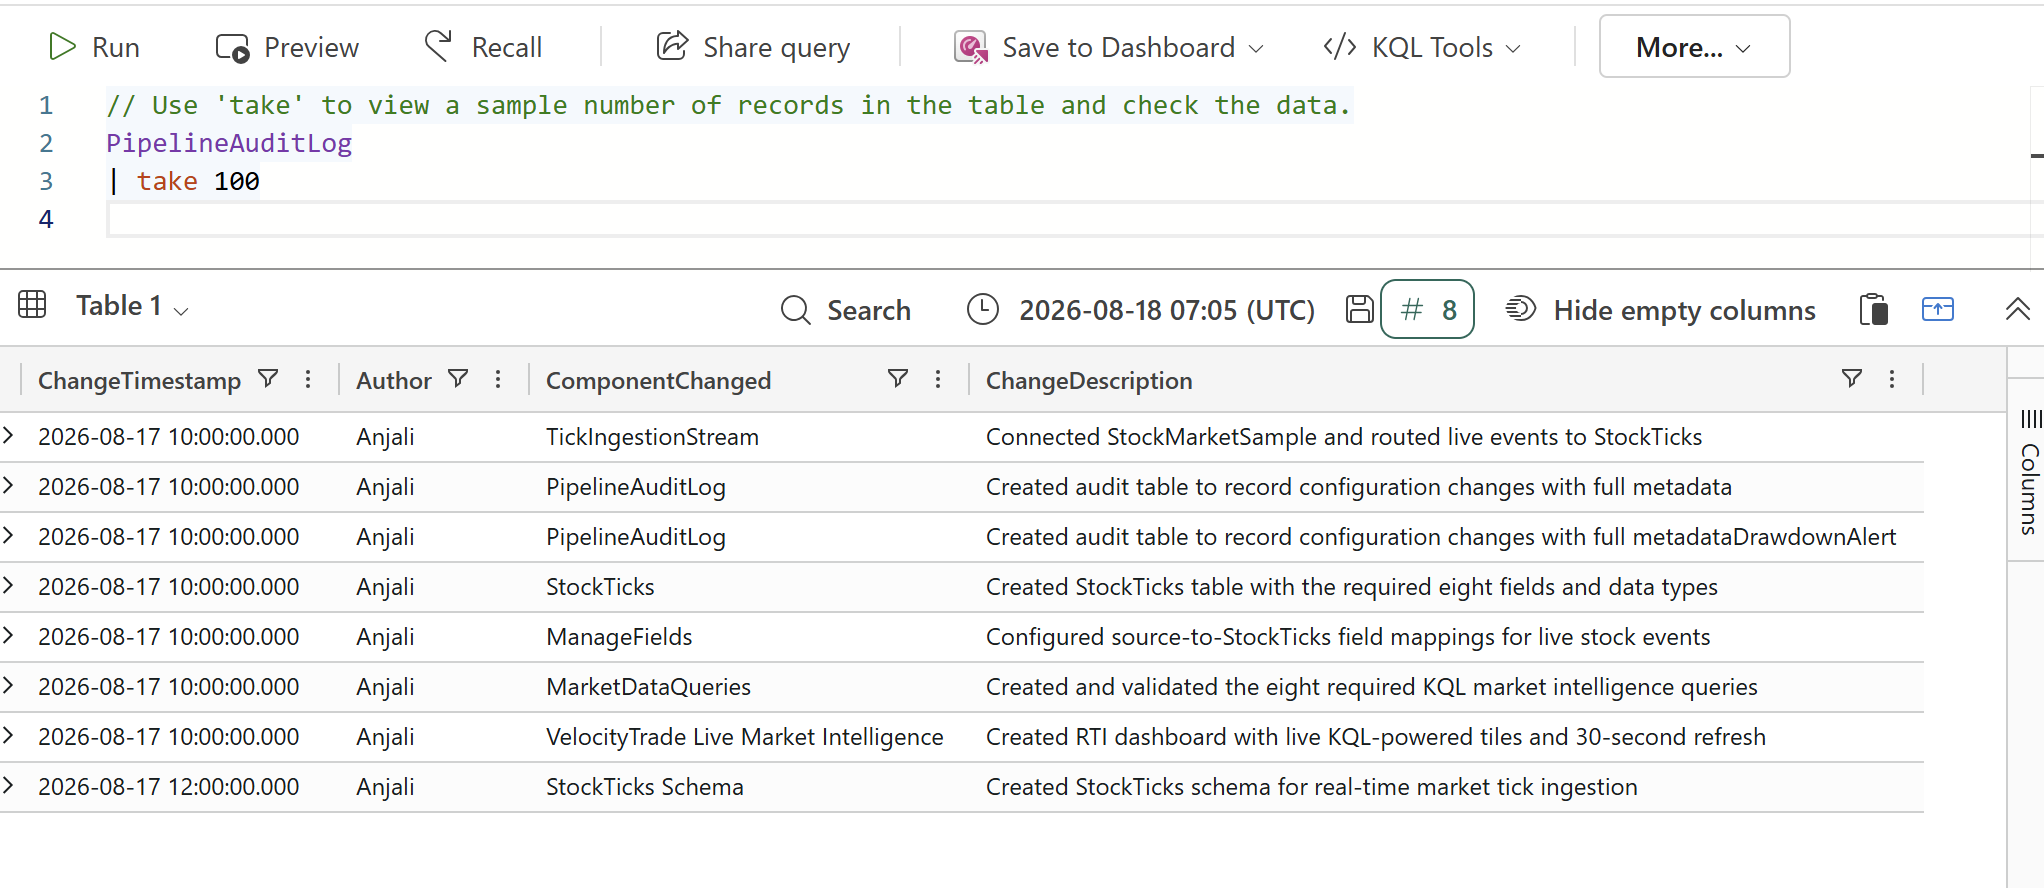
Verified PipelineAuditLog captured every configuration change across all components with
no gaps, then documented a full trace of a single tick event from source through stream,
table, query, dashboard tile, and alert evaluation.
Ingestion query:
 View full size (opens in a new tab)
Final output of the audit log:
 View full size (opens in a new tab)